
In the real world, we face many problems where several factors affect a certain outcome. Something as simple as a school result depends upon different subjects (including physical activity) that serve as variables/ factors altogether in deciding the result. A change in any of the subject marks directly affects the result of the student.
Multivariate Analysis refers to the analysis of several data variables at once to recognize patterns and collect information. It means you take different variables under consideration altogether, find their relationship, deduce how they affect the outcome, and then predict the outcome.
To further understand multivariate analysis, we must take an example of having multiple factors that conclude to an outcome.
Let’s take the example of the happiness index of world wherein 6 factors conclude the score of a country which in turn results as an overall rank. Here is the code in Jupyter notebook to analyse this data.
The first five entries of the data look like this:
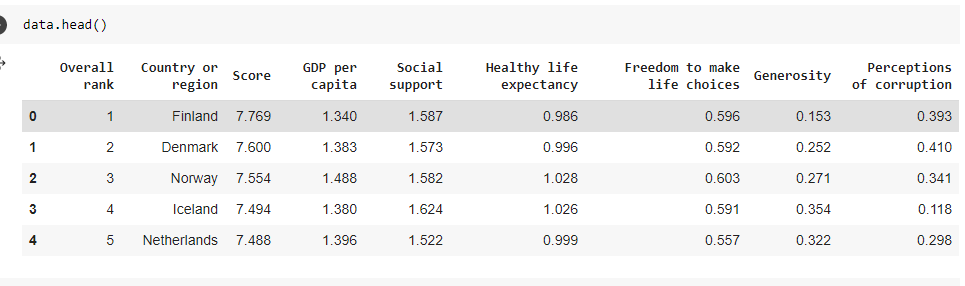
Now there are various factors that affect the happiness of a country and there are various things that we should know about them.
Co-variance:
Covariance tells us about the relationship between two variables as positive or negative. It gives us the direction of the relationship between two variables.
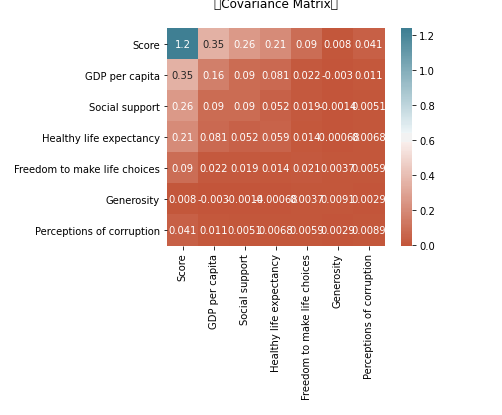
In a positive relation, if one variable increases, the other does so and if one decreases, others also decrease.
In a negative relation, on the contrary, if one variable increases, the other one decreases, and vice versa.
The values of co-variance can lie anywhere between negative infinity to positive infinity as its data is not standardized. Due to this extreme range, it becomes arduous to determine the strength of the relationship.
Co-relation:
Co-relation coefficients are standardized so it gives us the strength of the relationship between two variables.
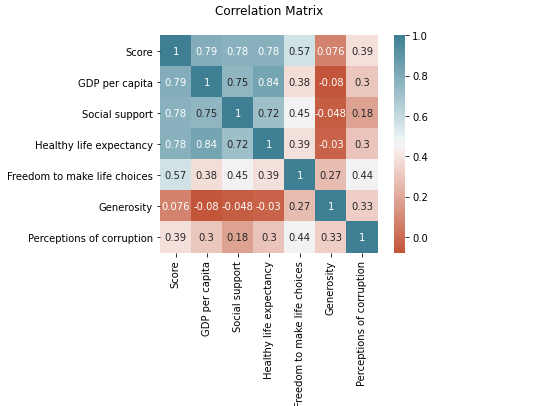
The strength and direction of the linear relationship between two variables are measured in a range of -1 to 1 where 1 is a strong relationship in the same direction while -1 means a relationship in the opposite direction.
When two or more independent are strongly related to each other then it is called multicollinearity.
Multivariate analysis means comparing more variables together so as to know better about a situation/ problem.
Conclusion: Multivariate analysis considers a combination of different variables to see how they affect the final outcome. In this article, we found out the difference between covariance and correlation. We used different charts to visualize different variables in the data. We also viewed the data of the top 10 and bottom 10 countries to see what the differences are.