There is no doubt that Google Analytics is one of the best tools to implement digital analytics tracking on a website and it’s being most widely used. But most of its important components are often misunderstood by people or simply they are not aware of them. Scopes is one of those features.
Today I am going to cover this topic Scope. It is the most difficult one to understand than others according to me but if you’ll understand it properly, believe me most of your questions regarding custom dimensions, custom metrics, custom reports and events will be solved.
Scopes in Google Analytics provide us the knowledge about how long in time a particular information is valid. Scopes are the characteristics of dimensions and metrics in Google Analytics. Metrics and dimensions can only have one scope, so it is important to align metrics and dimensions on the same scope level, or else reports will be mismatched.
Scopes are very valuable to us as they provide us with data such as the number of users on a particular page or the major traffic sources or the time spent on the pages etc. This kind of information decides if our goal for the website is met or not.
Types of scopes in Google Analytics
The most important scopes are of 3 types. There are other also, but we’ll discuss these 3 only as these are mostly used:
1. User: The Information that remains valid for a user for all the times he’s surfing a website . For example, Device or browser.
2. Session: The information that remains valid throughout a browsing session. A session can have multiple hits from a single or more users. For example, an IP address.
3. Hit: The information that remains valid for a smaller amount of time such as time taken to mark a single action. For example, Page view or any other event triggered.
To understand this better let us take an example of a guy whose name is John and he’s on a vacation. Everyday he’s wearing a different color T-shirt and he does 3 activities in the morning, afternoon and evening time. So far quite simple.
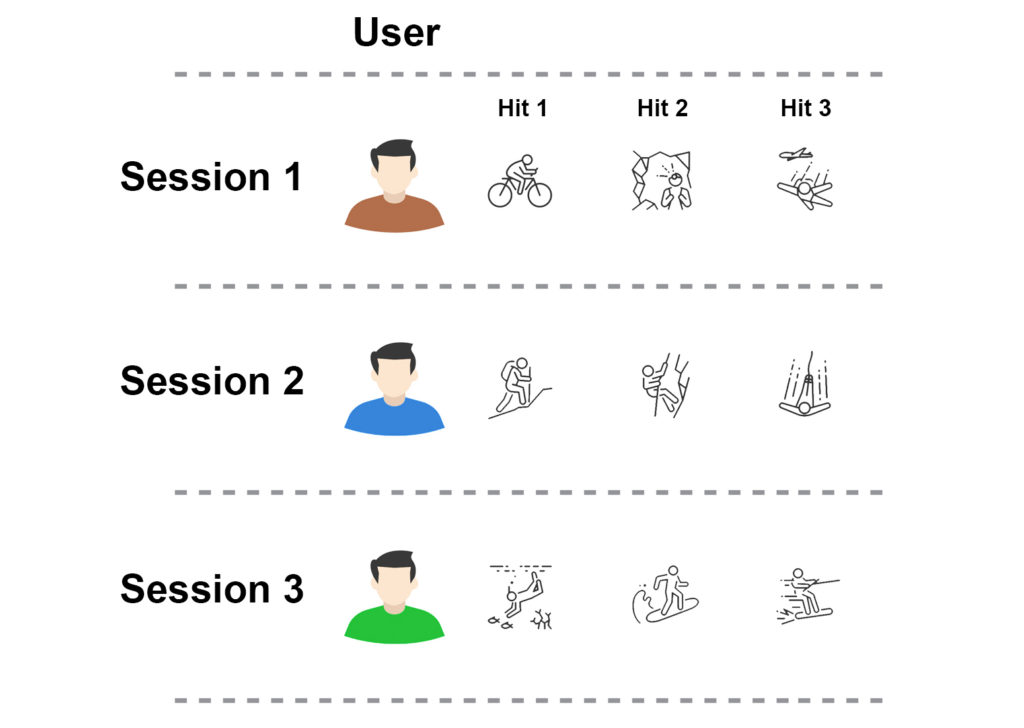
If we try to apply scopes here, then his name “John”, is a user scope level metric. His name will be the same regardless of when he’s waking up and doing various activities. In a real case scenario user scope level metric can be his web browser.
Note: One should understand that the number of users in Google analytics does not mean the real count of people visiting the website but it is just a browser count. It means if a user is visiting a site with multiple browsers then it is counted as more than one individual, the number of users will be the number of browsers.
Session scope level metric in this case will be color of his T-shirt. A session will be the same for all day during his different activities. In a real case scenario session scope level metric is traffic source for e.g Organic, Referral or Direct. It will be recorded once and will be valid for that session.
Note: In GA a session expires after 30 minutes of inactivity of a user. That means if the same user browses the website after 30 minutes of inactivity, a new session will be recorded. 30 minutes is a default value and you can also change it according to your website.
Hit level metrics in this case are the different activities he’s doing everyday such as snorkeling, hiking etc. Activities can change different times a day and can be different everyday. So hit scope level metrics are different everyday and are valid for that session. In real case scenario hit level metrics in GA can be page view, event etc.
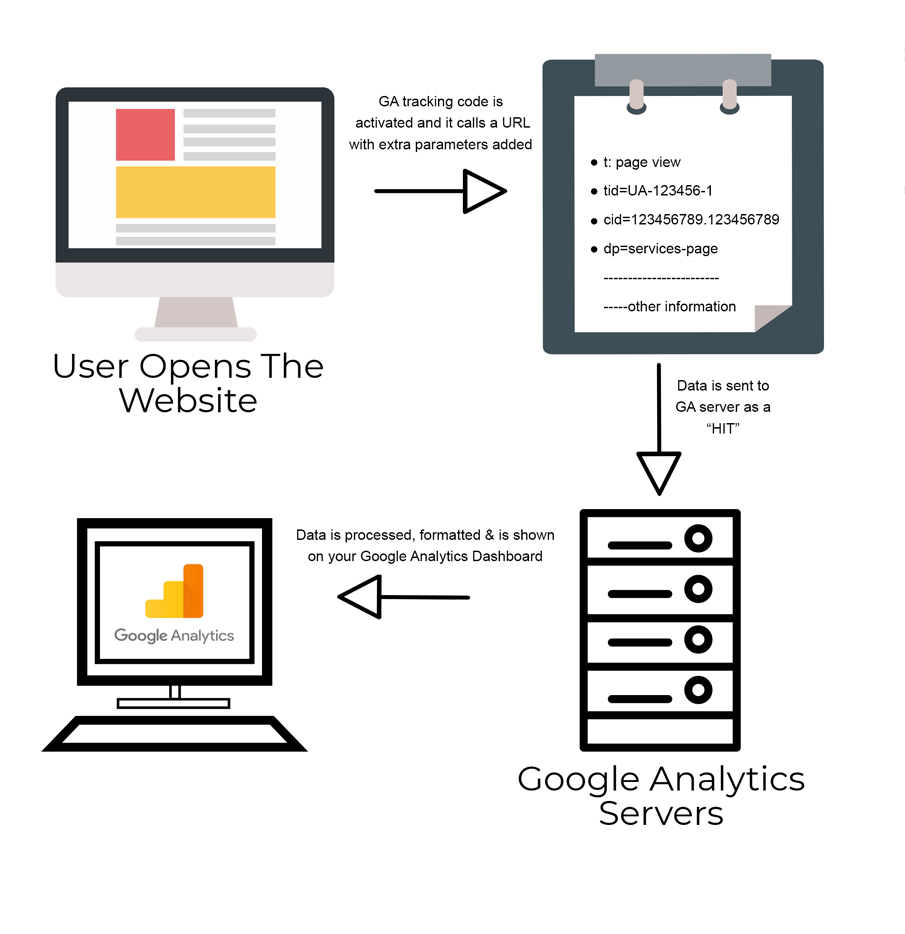
The way information travels to Google Analytics
When a user visits a web page, Google analytics tracking code gets activated and it calls the analytics server URL with extra information added to it in the form of parameters.
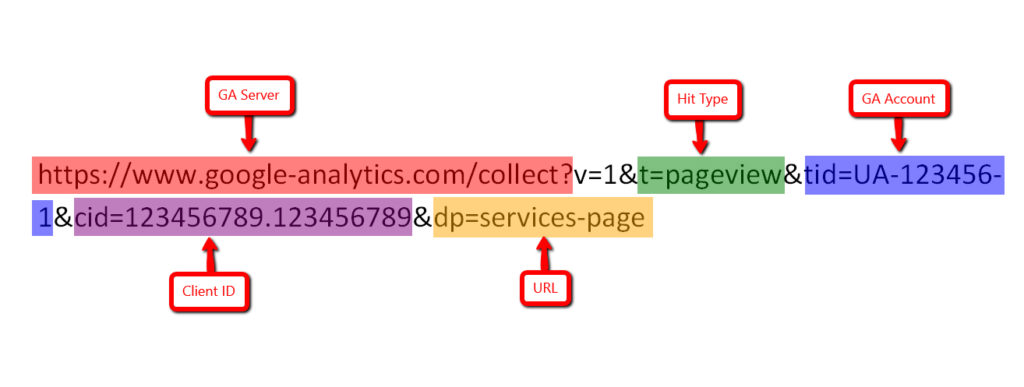
It sends information back to the server as a “HIT”. The number of hits makes up a table also known as building Bricks in Google Analytics.
The hit should not only be seen as a dimension here, as here, hits are just a bulk of information sent every time the tracking code is loaded.
A hit contains information like Client Id, Time of the hit, and the Page viewed. Generally, during a session multiple hits are made as users visit different pages on the website.
Data processing flow in Google Analytics
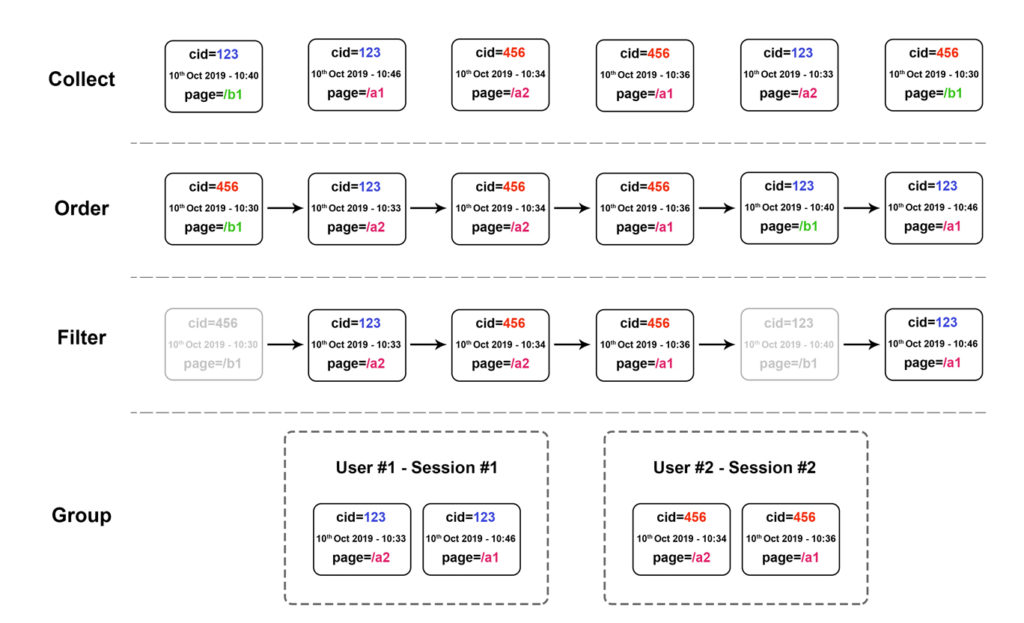
1. The Collection Step
Under this bulk of hits (information) is collected. A large number of data of every user who visited the website along with the pages is sent, all in different hits. That means, if a user viewed 5 different pages then 5 different hits are sent and a session is counted.
2. The Ordering Step
The second step here, will be ordering of that data in chronological order based on time sequence from the earliest time to the latest time.
3. The Filtration Step
The data from the second step will be filtered in the desired order. For example, we want to filter the data coming for pages of a special category called “XY”. Now all the data of pages XY1, XY2… XYN will be filtered to come forth.
4. The Grouping Step
Under this step, the filtered data from the 3rd step grouped as each for a specific user. The data will be shown in the form of hits and only the information specific to the filtered pages will be shown.
For example, if a user ABC visited XY2, XY5, and XY9 pages then 3 hits for that session of the user will be shown.
Application of scopes in Google Analytics
To understand the application of scopes in Google Analytics we must be aware of some facts. The facts are:
a. There is no session Id included in the hits sent to Google Analytics.
b. The Session scope is a calculated metric.
c. The Session scope and Hit scope has no direct connection between them.
Keeping these things in mind will help us to know how valuable information is extracted from scopes and the order in which the Scopes are applied to get the required information.
If you’ll apply the scopes in right order in your custom reports, then you’ll have accurate data there. Otherwise you’ll just get random or faulty data and you’ll never know what went wrong there.
Let us, here, suppose of a table of the scopes we came to know in the first subtopic of the article.
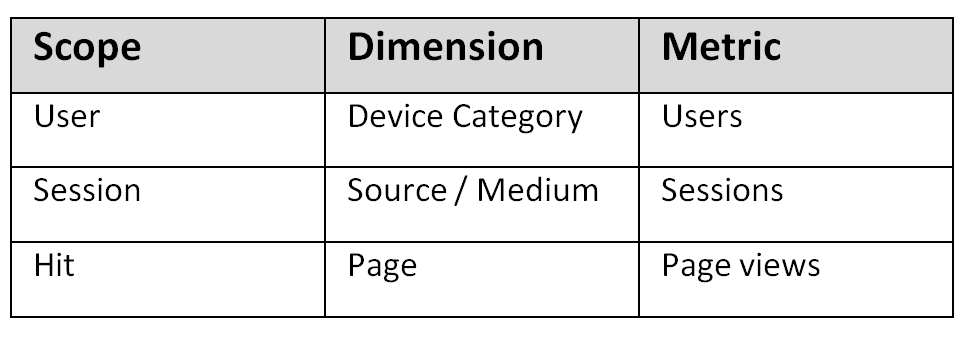
There are usually three approaches applied to extract the information and make your custom reports –
1. Go bottom approach
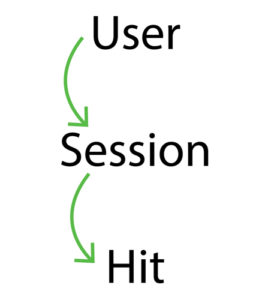
Under this, firstly, dimension from the User scope is kept as a primary dimension, say Device category on which the metrics of all the scopes are known.
Then dimension from the Session scope is kept as primary and Metrics of the session and Hit scopes are known.
Then, at last the Hit scope’s dimension is kept as primary and only the metric of Hit scope is calculated. Also, note that only this sequence from top to bottom i.e. from the user to hit scope is followed to get accurate data in reports.
For example:
From the User scope, we want to know the number of users coming from mobiles, no. of sessions and no. of pageviews. These all metrics will have correct data.
From the Session scope, we want to know, the number of sessions and the pages viewed during them. These all metrics will have correct data.
From the Hit scope, we want to know, the number of pageviews. As explained above, only the metric of the hit scope is known.
This approach makes the most sense as all the numbers that come from extracting this data are useful and make up a lot of value to us. For say, pages viewed by a user in a particular session is a piece of important information for us.
2. The Bottom-up approach
This is a very problematic approach whose results are either very tough to comprehend or make no sense to the analyst.
Under this approach, the dimension of the Hit scope is kept as the primary dimension and Metric values from all the scopes are calculated. But as stated above there is no connection between the session scope and hit as there is no session-id attached to the hits sent to the Google Analytics.
Let’s say, you kept Page from the Hit Scope as a primary dimension and now you want to know about the sessions then a random number is shown in analytics interface that won’t make any sense.
Another example is, if you keep source as a primary dimension and try to know about the users then a number showing users will be shown. That won’t make any sense as that number won’t be for specific devices or pages for that matter.
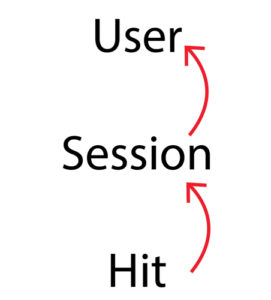
3. The Hit-User approach
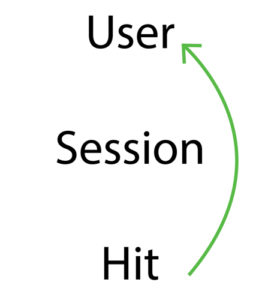
This approach has a limited set of values to give as a result but can be of good use to us. In this approach, the Session Scope is skipped entirely. The focus is only on the Hit Scope and User Scope.
Let’s say you keep the page dimension from the Hit Scope as a primary dimension and try to know about the number of users for a specific page. Then this information is very valuable as it will decide if that specific page is a success or not.
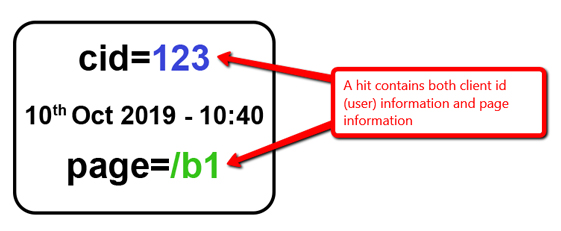
If we just examine the hit from the image of data processing flow in GA, you’ll get above image. You will know that a hit contains user id and page information so that means going from hit scope to directly user scope will give us accurate data.
Users must know how to apply these scopes to gain a better knowledge of the traffic. A correct approach can give us the result we desire that makes sense to us in our custom reports. Otherwise, random data numbers will only confuse the user and make things more complex.
Conclusion: In this article, we’ve learned about scopes and how data processing works in Google analytics. We’ve also learned about the types of approaches to apply these scopes in a better way to get valuable information. If you have any questions, I would love to hear them in the comments below.